
NASA: Tracking Dust Across the Atlantic - 09.11.13
Posted by Ricardo Marcenaro | Posted in NASA: Tracking Dust Across the Atlantic - 09.11.13 | Posted on 12:28

acquired July 31, 2013
download large image (15 MB, JPEG, 16000x12000)
Hundreds of millions of tons of dust
are picked up from the deserts of Africa and blown across the Atlantic
Ocean each year. That dust helps build beaches in the Caribbean and
fertilizes soils in the Amazon. It affects air quality in North and
South America. And some say dust storms might play a role in the
suppression of hurricanes and the decline of coral reefs.

acquired August 1, 2013
download large image (16 MB, JPEG, 16000x12000)
To get a sense of the scale of these storms, you need to get into
space and you need more than one orbit. The natural-color images above
and below were captured by the Visible Infrared Imaging Radiometer Suite
(VIIRS) on the Suomi National Polar-orbiting Partnership (Suomi NPP) satellite on July 31 and August 1–2, 2013. As the spacecraft orbits 824 kilometers (512 miles) above the Earth from pole to pole,
it observes swaths that are roughly 3,000 kilometers (1,800 miles)
across. Each image is a composite of three adjacent satellite passes.
Dust from the Sahara Desert and other points in interior Africa were lofted into the sky in late July 2013, and the images above show the general westerly and northwesterly progression of the airborne particles across the Atlantic Ocean. (Note that the milky lines running vertically across each image are caused by sunglint, the reflection of sunlight off the ocean directly back at the sensor.) The images help reveal wind patterns (such as trade winds) that steer plumes and clouds. At several points, dust stretched continuously from North Africa to South America.
Dust from the Sahara Desert and other points in interior Africa were lofted into the sky in late July 2013, and the images above show the general westerly and northwesterly progression of the airborne particles across the Atlantic Ocean. (Note that the milky lines running vertically across each image are caused by sunglint, the reflection of sunlight off the ocean directly back at the sensor.) The images help reveal wind patterns (such as trade winds) that steer plumes and clouds. At several points, dust stretched continuously from North Africa to South America.

acquired August 2, 2013
download large image (16 MB, JPEG, 16000x12000)
“These mosaics show where the dust goes, which tells us what governs
the movement and where they end up,” said Ralph Kahn, a NASA atmospheric
scientist who specializes in aerosols. “When satellites first began
imaging Earth, it was shocking to see the degree to which airborne
particles are carried across continents and oceans. This motivated work
in atmospheric ‘teleconnections’ in general, and aerosol transport in particular.”
The dust also was detected by the Ozone Mapping Profiling Suite (OMPS) on Suomi NPP. The maps below show the relative concentrations of aerosol particles on July 31 and August 1-2. While designed to measure ozone in the atmosphere, OMPS gathers ultraviolet spectral information that reveals the presence of smoke and airborne dust. Lower concentrations appear in yellow, and greater concentrations appear in orange-brown. Each map includes roughly six satellite passes. (Note: sunglint also causes some vertical banding in these images.)
The dust also was detected by the Ozone Mapping Profiling Suite (OMPS) on Suomi NPP. The maps below show the relative concentrations of aerosol particles on July 31 and August 1-2. While designed to measure ozone in the atmosphere, OMPS gathers ultraviolet spectral information that reveals the presence of smoke and airborne dust. Lower concentrations appear in yellow, and greater concentrations appear in orange-brown. Each map includes roughly six satellite passes. (Note: sunglint also causes some vertical banding in these images.)
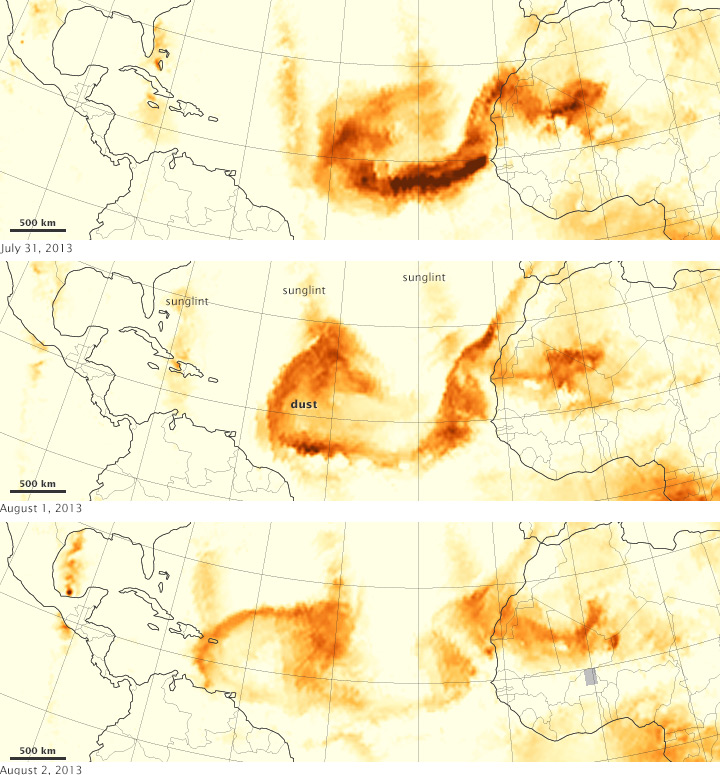
acquired July 31 - August 2, 2013
You can watch an animated gif of dust progression by clicking here. A joint French-American satellite, CALIPSO, also captured a vertical profile of the dust plume over the Leeward Islands, which you can see here.
Since late July, some meteorologists have speculated that a particularly dry and dusty Saharan Air Layer was suppressing hurricane formation in the North Atlantic. As of August 27, 2013, no tropical storms had reached hurricane strength yet in the Atlantic Ocean, an unusual but not unprecedented season.
On short-term scales, dry air masses from Africa can sap the moisture-collecting energy of storm systems over the ocean. On the longer scale (years or longer), more dust can mean fewer storms because it blocks incoming sunlight, leading to cooler ocean temperatures. Deciphering the effect of Saharan air and dust is one of the research goals of NASA’s Hurricane and Severe Storm Sentinel (HS3) airborne field campaign this year.
This final view (below) of the dust storm is a composite of VIIRS images from August 1, 2013. The hemispherical projection was created from seven orbits of Suomi NPP.
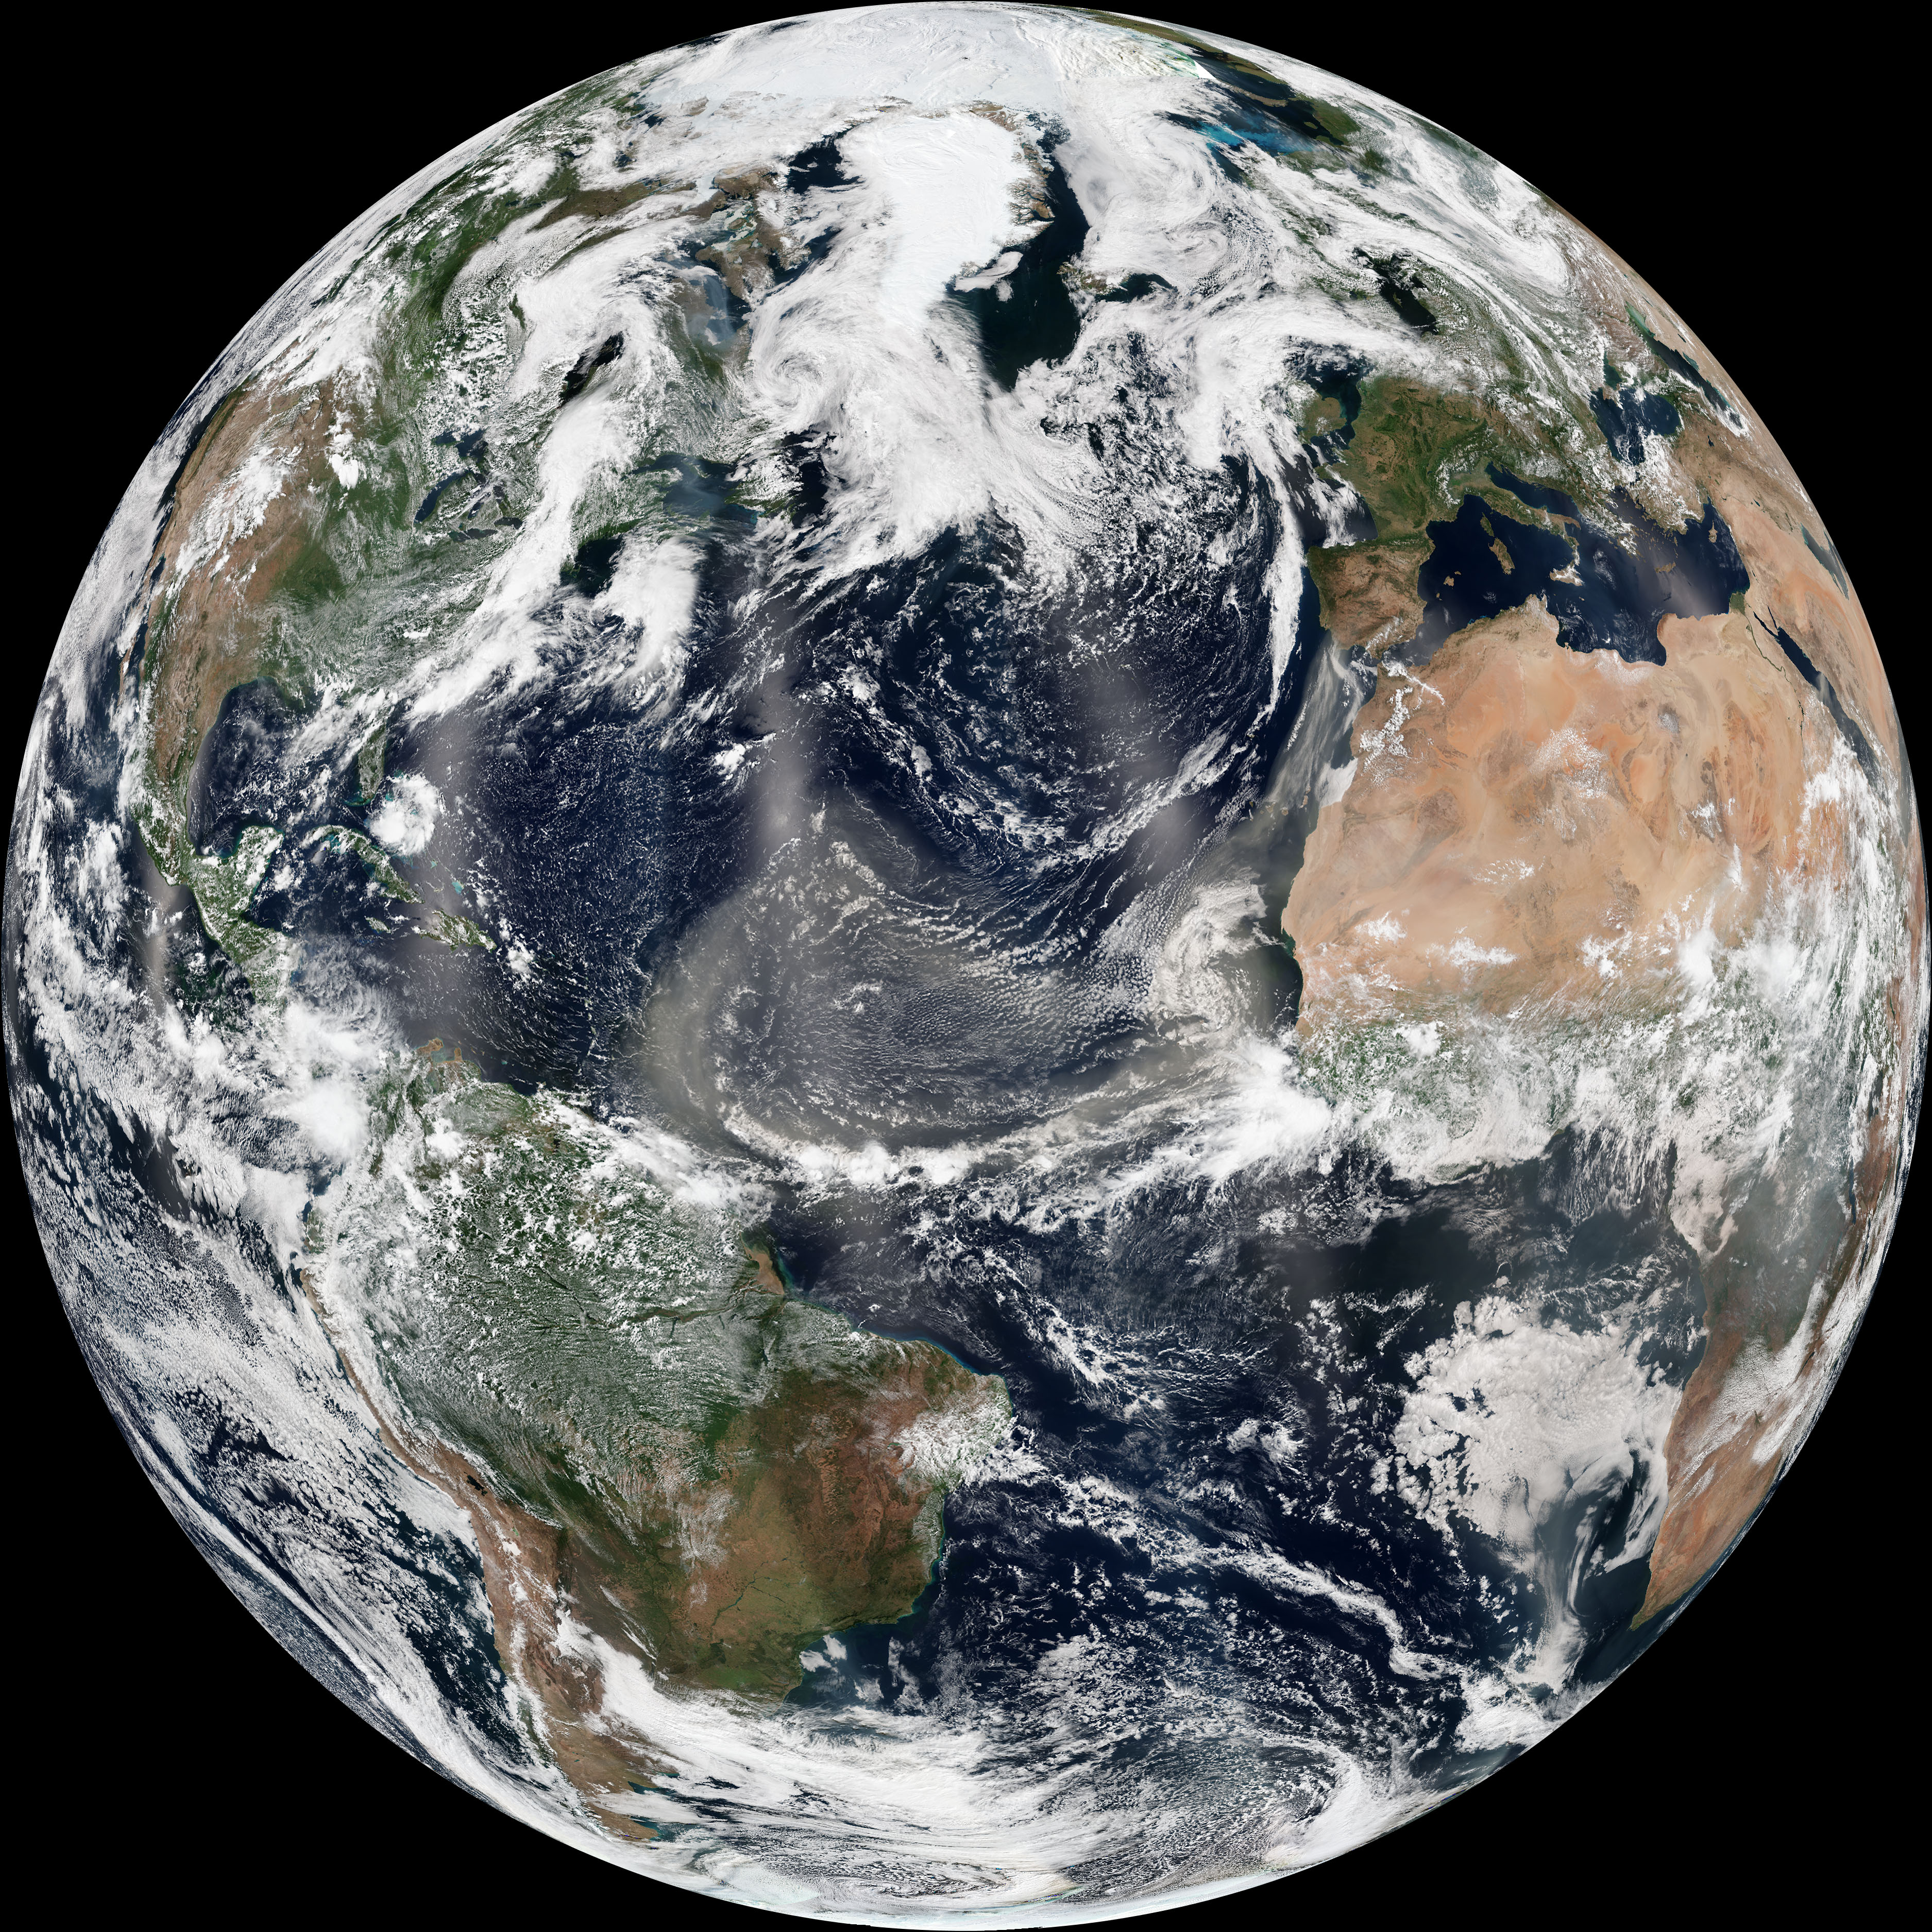
acquired August 1, 2013
download large image (3 MB, JPEG, 3750x3750)
“Dust has long blown across the Atlantic from Africa, but only during
the past several decades of satellite observations have we begun to
appreciate the vast scale of these events,” wrote Norman Kuring, a
member of the ocean color group at NASA Goddard. “Estimates of the dust
transported run to hundreds of millions of tons per year, yet we still
know relatively little about the effects on phytoplankton productivity,
climate, and human health.”
Here are some more satellite images of Saharan dust in the summer of 2013:
Further Reading
- CIMSS Satellite Blog, University of Wisconsin (2013, August 2) Saharan Air Layer outbreak over the Atlantic Ocean. Accessed August 24, 2013.
- NASA (2012, August 2) Dust Dominates Foreign Aerosol Imports to North America. Accessed August 24, 2013.
- OMPS Blog, Suomi NPP (2013, August 7) Saharan Dust over the Middle of the U.S. Accessed August 24, 2013.
- Prospero, J.M. and Mayo-Bracero, O.L. (2013) Understanding the Transport and Impact of Atlantic Dust on the Caribbean Basin. Bulletin of the American Meteorological Society.
- The Smog Blog, University of Maryland–Baltimore County (2013, August 3) Fires continue to plague the West. Accessed August 24, 2013.
- U.S. Geological Survey (2013) The Effects of African Dust on Coral Reefs and Human Health. Accessed August 24, 2013.
- VIIRS Imagery and Visualization Team Blog, Suomi NPP (2013, August 2) Abafado Bruma Seca. Accessed August 24, 2013.
- The Washington Post (2013, July 31) Huge African dust storm squashes Atlantic hurricane potential. Accessed August 24, 2013.
- Weather Underground (2013, July 31) Massive African Dust Storm Cooling Atlantic Hurricane Odds for Early August. Accessed August 24, 2013.
NASA Earth Observatory image by Jesse Allen and Robert Simmon, using VIIRS data from the Suomi National Polar-orbiting Partnership and OMPS data
provided courtesy of Colin Seftor (SSAI). Suomi NPP is the result of a
partnership between NASA, the National Oceanic and Atmospheric
Administration, and the Department of Defense. Caption by Mike
Carlowicz, with interpretation from Colin Seftor, Scott Braun, and Ralph
Kahn from NASA’s Goddard Space Flight Center and Steve Miller of
Colorado State University.
- Instrument:
- Suomi NPP
NASA: Tracking Dust Across the Atlantic - 09.11.13
Ricardo M Marcenaro - Facebook
Blogs of The Solitary Dog:
solitary dog sculptor:
http://byricardomarcenaro.blogspot.com
Solitary Dog Sculptor I:
http://byricardomarcenaroi.blogspot.com
Para:
comunicarse conmigo,
enviar materiales para publicar,
propuestas:
marcenaroescultor@gmail.com
For:
contact me,
submit materials for publication,
proposals:
marcenaroescultor@gmail.com
My blogs are an open house to all cultures, religions and countries. Be a follower if you like it, with this action you are building a new culture of tolerance, open mind and heart for peace, love and human respect.
Thanks :)
Mis blogs son una casa abierta a todas las culturas, religiones y países. Se un seguidor si quieres, con esta acción usted está construyendo una nueva cultura de la tolerancia, la mente y el corazón abiertos para la paz, el amor y el respeto humano.
Gracias :)

Comments (0)
Publicar un comentario