NASA: A Quiet Interlude in Solar Max - 19.03.13 - 1 Vid
Posted by Ricardo Marcenaro | Posted in NASA: A Quiet Interlude in Solar Max - 19.03.13 - 1 Vid | Posted on 22:03

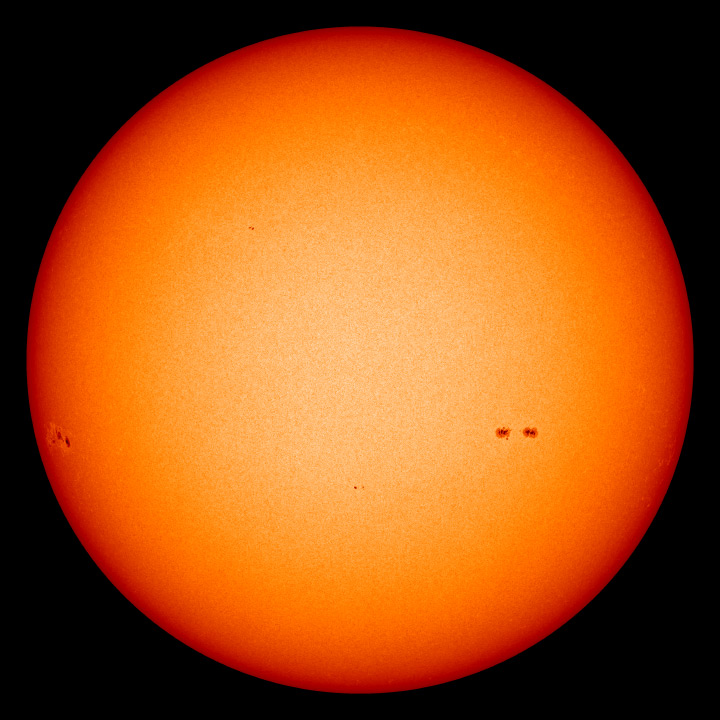
acquired February 28, 2013

acquired February 28, 2013
download large image (314 KB, PDF)
acquired February 1 - 28, 2013
download web resolution animation (2 MB, QuickTime)
acquired February 1 - 28, 2013
download high definition animation (49 MB, QuickTime)
acquired February 28, 2013
download large image (4 MB, JPEG, 4096x4096)
Solar physicist Dean Pesnell of NASA’s Goddard Space Flight Center has a different explanation. “This is solar maximum,” he says. “But it looks different from what we expected because it is double-peaked.”
Conventional wisdom holds that solar activity swings back and forth like a simple pendulum. At one end of the cycle, there is a quiet time with few sunspots and flares. At the other end, solar max brings high sunspot numbers and frequent solar storms. It’s a regular rhythm that repeats every 11 years.
Reality is more complicated. Astronomers have been counting sunspots for centuries, and they have seen that the solar cycle is not perfectly regular. The back-and-forth swing in sunspot counts can take anywhere from 10 to 13 years to complete. Also, the amplitude of the cycle varies; some solar maxima are very weak, others very strong.
The top image above shows the Earth-facing surface of the Sun on February 28, 2013, as observed by the Helioseismic and Magnetic Imager (HMI) on NASA’s Solar Dynamics Observatory. HMI observes the solar disk at 6173 Ångstroms, a wavelength designed to study surface oscillations and the magnetic field. HMI observed just a few small sunspots on an otherwise clean face, which is usually riddled with many spots during peak solar activity. The video below shows a full solar rotation observed by HMI from February 1-28, 2013. (Download the animation from the links below the image.)
Pesnell notes yet another complication in the solar cycle: “The last two solar maxima, around 1989 and 2001, had not one but two peaks.” Solar activity went up, dipped, then rose again, performing a mini-cycle that lasted about two years. The same thing could be happening now, as sunspot counts jumped in 2011 and dipped in 2012. Pesnell expects them to rebound in 2013: “I am comfortable in saying that another peak will happen in 2013 and possibly last into 2014,”
The second image above plots monthly sunspot numbers for solar cycle 24 (the current one), cycle 23, and cycle 21, the last one with one, normal peak.
Another curiosity of the solar cycle is that the Sun's hemispheres do not always peak at the same time. In the current cycle, the south has been lagging behind the north. The second peak, if it occurs, will likely feature the southern hemisphere playing catch-up, with a surge in activity south of the Sun's equator.
Pesnell is a member of the NOAA/NASA Solar Cycle Prediction Panel, which last assembled in 2008 to forecast the next solar maximum. The panel declared: “The next solar cycle (Cycle 24) will be below average in intensity, with a maximum sunspot number of 90. Given the date of solar minimum and the predicted maximum intensity, solar maximum is now expected to occur in May 2013.”
Given the tepid state of solar activity now, a maximum in May seems unlikely. “We may be seeing what happens when you predict a single amplitude and the Sun responds with a double peak,” says Pesnell. He notes a similarity between Solar Cycle 24 and Solar Cycle 14, which had a double-peak during the first decade of the 20th century. If the two cycles are twins, “it would mean one peak in late 2013 and another in 2015.”
NASA images courtesy Solar Dynamics Observatory and Helioseismic and Magnetic Imager science teams. Sunspot number data
from the NOAA National Geophysical Data Center. NASA animation by
Robert Simmon. Caption adapted from a story by Tony Phillips, Science@NASA.
- Instrument:
- SDO - HMI
NASA: A Quiet Interlude in Solar Max - 19.03.13 - 1 Vid


Comments (0)
Publicar un comentario